At a Glance
The Dashboard provides an immediate, high-level view of your AI workforce. It allows you to monitor spend, track lead volume, and audit individual conversations in real-time.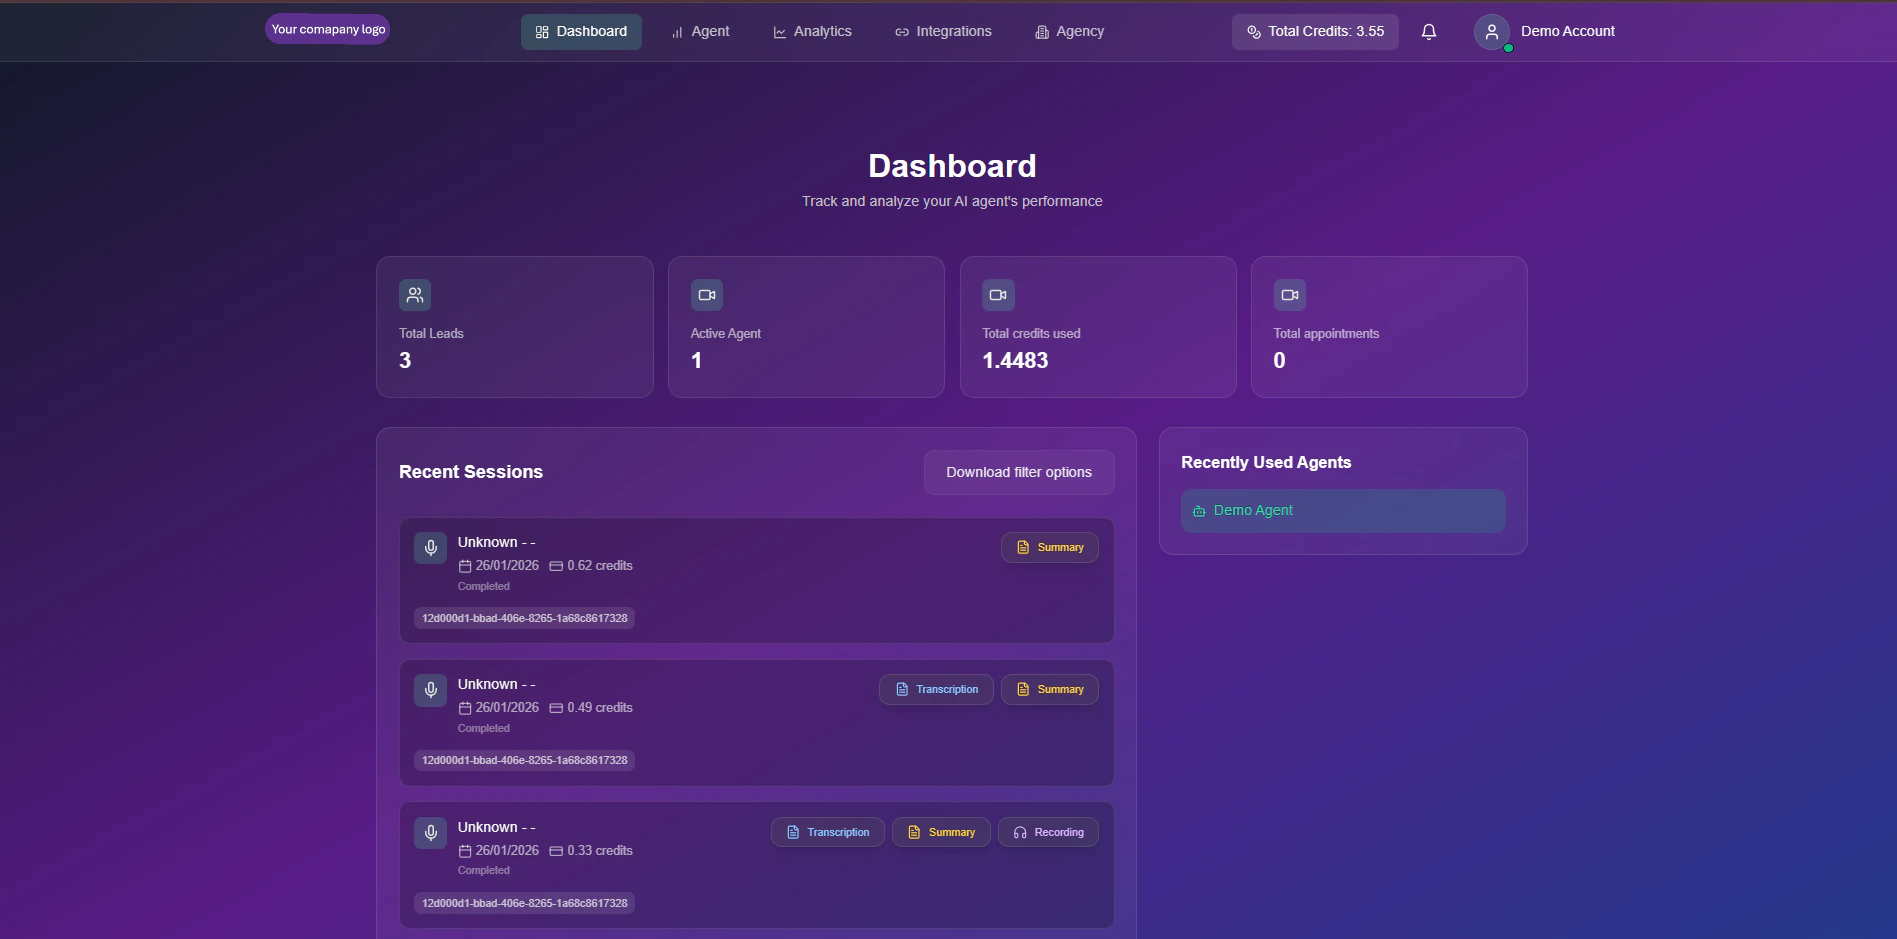
The Snowie Command Center
Video Walkthrough
Watch a quick tour of the dashboard features and metrics.Performance Metrics
Located at the top of the view, these 4 KPIs give you the pulse of your operation:Total Leads
Volume Tracker: The cumulative number of contacts your agents have engaged with.
Active Agents
Deployment Status: The number of unique agents currently online and ready to take calls.
Total Credits
Resource Usage: Total credits consumed across all agents. (1 Credit ≈ 1 Minute).
Appointments
Conversion Success: Confirmed bookings directly synced to your calendar.
Activity Feed
The main body of the dashboard displays a chronological log of all agent interactions. You can click on any row to expand the full session details.Session Data Columns
Session Data Columns
- Caller ID: The name or phone number of the contact.
- Date & Duration: When the call occurred and how long it lasted.
- Cost: The exact credit deduction for that specific session.
- Status: Visual tags indicating
Completed(Green),Missed(Red), orFailed(Gray).
Session Tools (Click to View)
Session Tools (Click to View)
Inside each session, you can access forensic tools for quality assurance:
- 📝 Transcription: A full text log of the conversation.
- 🧠 AI Summary: A concise recap of the user’s intent and the call outcome.
- ▶️ Audio Recording: Listen to the raw audio file to verify agent tone and accuracy.