Overview
The Transactions tab serves as the financial ledger for your agency. It logs every single economic interaction between you and your sub-accounts, providing a transparent audit trail for revenue and credit flow.
Agency Financial Ledger
Revenue Metrics
The top ribbon displays a high-level summary of your financial performance.Total Revenue
The cumulative cash value of all plans and credits sold.
Active Users
The count of clients currently contributing to revenue.
Credits Issued
Total volume of AI credits distributed to your user base.
Growth Rate
The percentage increase in revenue over the last period.
Transaction Log
The main body of the page lists every individual event in chronological order.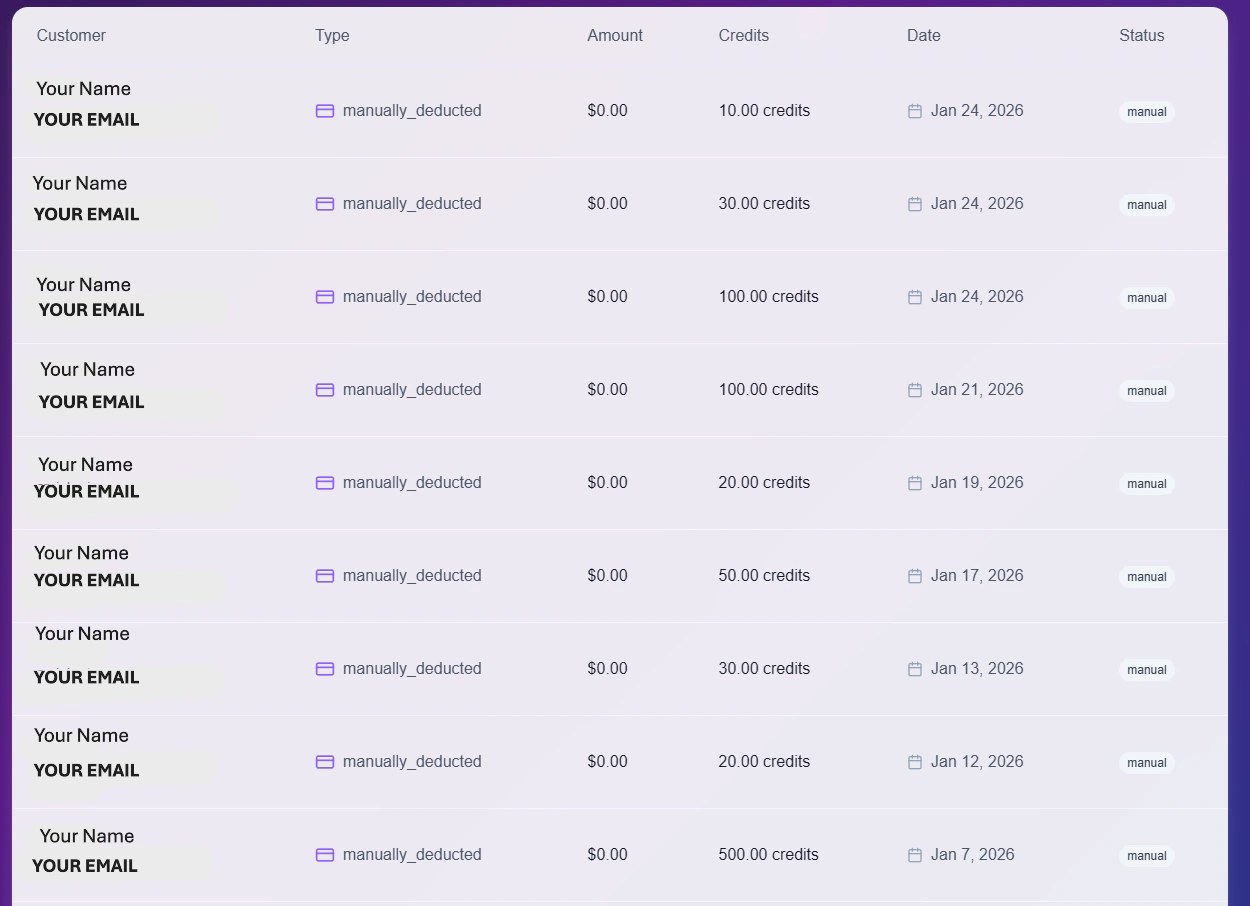
Detailed Transaction History
Data Columns
- Customer: The unique email and ID of the client involved.
- Type: The classification of the event (e.g.,
manually_deductedfor adjustments, orsubscription_paymentfor renewals). - Amount: The actual currency value (USD) processed, if applicable.
- Credits: The specific number of AI credits added or removed.
- Status: Visual indicator of the result:
Manual,Success, orFailed.
Tools & Filters
Use the control bar to analyze your data:- Search: Quickly locate specific transactions by typing a client’s email or ID.
- Filter: Toggle views to isolate specific payment types (e.g., View only Stripe charges vs. Manual adjustments).
- Export: Click the Export Data button to download the complete ledger as a CSV file for external accounting.